Skip to content
Wilson, KS 67490
test@test.com
24/7 Customer Support
Facebook-f
Twitter
Instagram
Home
Quizzes
Jobs
AI-Shiksha GPT
Shop
Classes
Contact
Menu
Home
Quizzes
Jobs
AI-Shiksha GPT
Shop
Classes
Contact
Question:
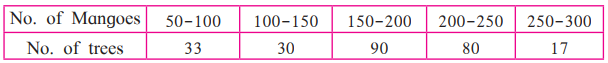
The frequency distribution table shows the number of mango trees in a grove and their yield of mangoes. Find the median of data.
Answer:
Using given data, we can construct a table.